The industry benchmark for media & entertainment — a single, transparent reference point for every company in the business, public and private alike. Built from the world's listed entertainment names and deliberately weighted to elevate pure-plays and smaller firms over the megacaps that dominate conventional market-cap indices.
Total-return basis (dividends reinvested), all constituents converted to USD. The AXIOM GEI is the headline series; equal-weight and cap-weight variants of the same basket are shown for context. Metrics above recompute for the selected timeframe.
The same 105-company global basket under four weighting schemes, versus the broad U.S. market. The contrast between them is the story of the decade in entertainment.
| Series | Level | Total return | CAGR | Volatility | Max drawdown | Sharpe |
|---|
Volatility annualized from daily returns; Sharpe = (CAGR − 2%) ÷ volatility, using a flat 2% risk-free rate applied identically to all four series (indicative only — short rates ranged from ~0% to ~5% over the period, so relative ranking is more meaningful than the absolute level). The S&P 500 is the total-return series, matching the GEI's own total-return construction. Correlation of AXIOM GEI to the S&P 500: 0.687 — a distinct benchmark, not a market proxy.
Reconstructed history and live record. The ten-year history is reconstructed, but not by applying today’s constituent set backwards. Membership is dated at both ends, and companies that have left are held through their own final sessions rather than dropped, so it is not a survivors-only history. What a reconstruction cannot establish is that these companies would have been chosen at the time; that judgement was made in 2026, and it is a different defect from survivorship. It should be read as a backtest, not as a live track record.
The index has run live since 2 July 2026. From that date values are recorded as they occur and no retrospective constituent selection is possible. A published close can still move for about a week while the price vendor re-adjusts its data; after that window it is not restated.
The reconstruction establishes the index. The live record is the benchmark.
If you weight an entertainment index by market value, it stops being an entertainment index. One company swamps everything.
On today's values, the five largest names — Apple, Alphabet, Amazon, Meta Platforms and Tencent Holdings — would be ~88% of a conventional cap-weighted version of this basket (the largest, Apple, 30.7% on its own). The "index" would simply track Big Tech, not entertainment.
We instead score every company on an importance tier (1–4) for how central entertainment is to the business, weight by that tier, and hold every name in a tier equally. Apple, Alphabet, Amazon and Meta are all present — but each at just 0.3%. Disney and the far smaller CD Projekt carry the same 1.2%. Size no longer decides influence — relevance does.
Most of this industry is private. The production companies, the studios, the labels, the agencies, the independents — very few are listed, and none of them can read their own conditions off a share price. That is exactly why I think this index is for them as well.
You would not use it to measure your P&L against Netflix’s stock, and it was never meant for that. You use it the way you use weather: to see the conditions the whole sector is working in, now and across the past decade.
As a CFO it answers the question I ask most often — is this us, or is this the market? When revenue softens, when a raise takes longer than planned, when an offer comes in below expectation, the first thing worth knowing is whether the sector moved too. Listed and private entertainment businesses sit in the same commissioning cycles, the same advertising market, the same cost of capital. The listed ones simply report daily.
That is the reference point I wanted: not a scorecard for any one company, but an honest read of the weather everyone in this business is trading in.
The 105 names grouped into the major entertainment segments. Weight is the share of the index each segment carries; YTD, 6M, 1Y and 10Y are the index-weighted trailing returns.
Bars scaled to the largest segment. YTD, 6M, 1Y and 10Y are index-weighted trailing returns (point-to-point) — not the return of a tradeable segment sub-index. “—” means too few names have a full window.
Survivors of the original 2017 AXIOM universe mapped through a decade of mergers, refreshed with newer entrants and broadened across Europe, Japan, Korea, China and India. Returns are since each name's entry — search, sort and filter the full basket below.
Entertainment churned violently between 2016 and 2026. Names left through takeovers, merged into new giants, or listed for the first time. Acquired names live on in the index through their corporate successors.
Transparent by design. Full construction rules, data sources and caveats are in the methodology note.
Publicly-traded entertainment companies across 16 countries and major exchanges (New York, London, Paris, Tokyo, Seoul, Mumbai, Hong Kong and more), each converted to USD. 105 constituents spanning ten reported segments — games, streaming, music, TV & broadcast, film & cinema, live & experiences, radio & audio, social & digital, diversified media and devices & tech, as of September 4, 2026.
Each company is hand-scored 1–4 for how central entertainment is to its business. Tier 1 (pure-play) counts 4×; tier 4 (peripheral, e.g. Apple) counts 1×.
Names in the same tier carry identical weight, so a small pure-play counts as much as a giant. This is what elevates smaller firms and caps megacap dominance.
Quarterly, on a total-return basis (dividends reinvested), base 1,000 at January 2016. Local prices are converted to USD; new entrants join at the first rebalance after listing.
Everything to 2 July 2026 is reconstructed on dated membership, so companies that have since left are held through their own exits rather than dropped: a backtest, but not a survivors-only one. From 2 July 2026 the index records itself hourly. A close can still move for about a week while the price vendor re-adjusts; after that it is not restated.
I'm a CFO, not an index provider — but I've wanted a benchmark like this for a long time. Here is the thinking behind it.
Finance runs on benchmarks. As a CFO, I am constantly asking how the companies I work with are performing against their peers and the wider sector. For most industries there is a clear reference point — a recognized index everyone knows. For media and entertainment, I could never find one that genuinely fit.
The broad-market indices are dominated by a handful of technology giants. Weight by market value and “entertainment” effectively becomes Apple, Alphabet and Amazon — not the studios, labels, game makers and venues that define the business day to day.
Assembling a decade of prices across dozens of markets, currencies and corporate changes had kept this on my wish-list for years. Building it with Claude is what finally made it achievable, for which I am genuinely grateful to Anthropic. Now that it exists, I am glad to share it with anyone who finds it useful.
So I built a straightforward, transparent benchmark of the companies that actually make up the industry, designed to keep the pure-play names in view rather than the megacaps. I am not claiming to have reinvented index construction — only to have built the version I always wanted and could never find.
Most of all, I hope it is genuinely useful to the people who run this industry. As a finance leader myself, I know how much easier the work becomes with a benchmark you can actually point to — and if this helps another CFO, investor or founder in media and entertainment frame a conversation, pressure-test a number, or simply see their corner of the business more clearly, then it has done exactly what I hoped. My aim is for it to be a shared reference the whole community can lean on, and I'm always happy to compare notes with fellow finance leaders who care about getting this right.
Tobias hosts The Media CFO — the show about the money, deals and dealmakers behind the global entertainment industry.
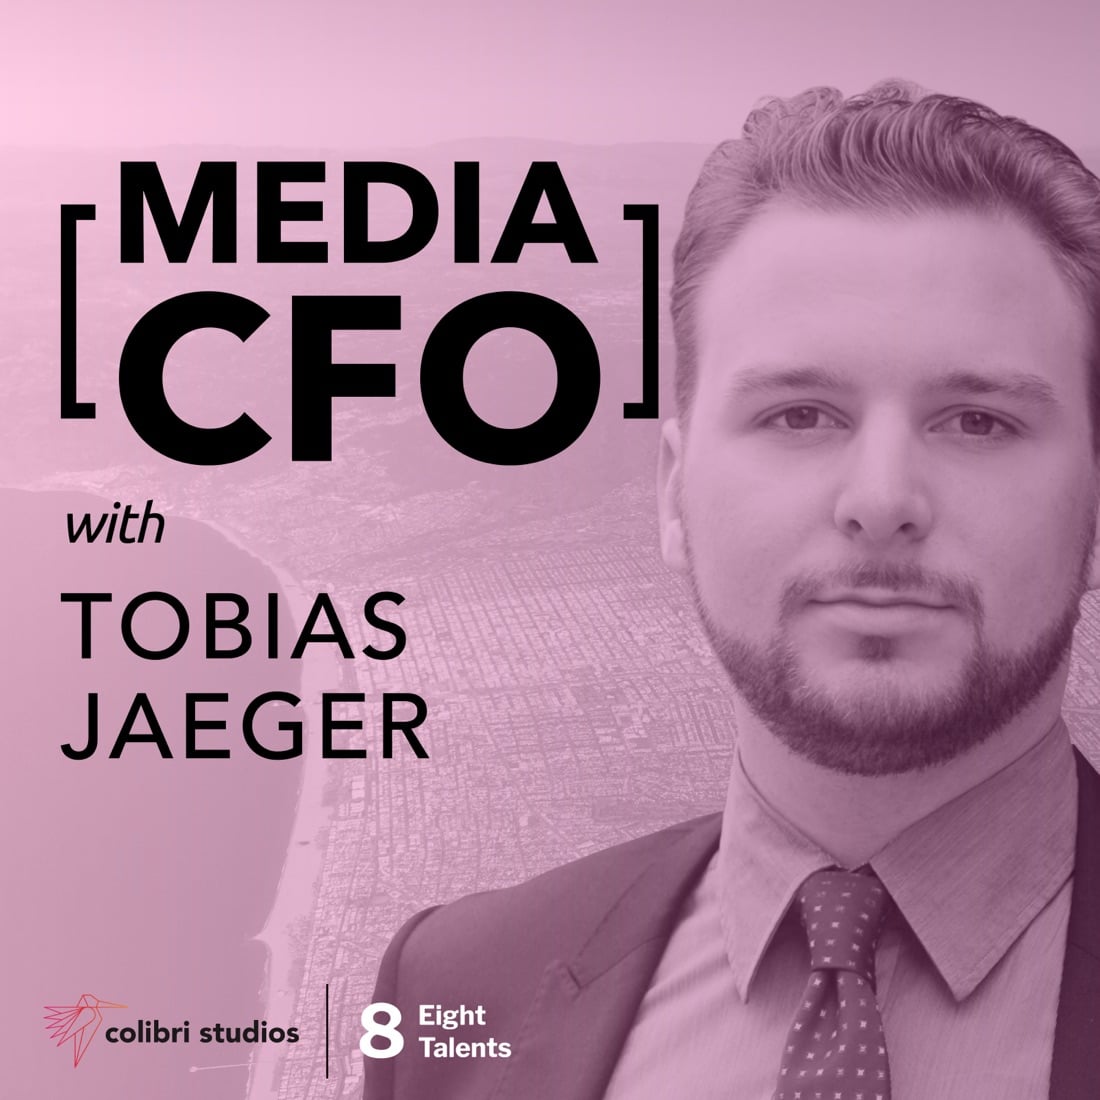
The world’s only show about the money, deals and dealmakers behind the global entertainment industry — deep conversations with the executives, founders and investors shaping film, television, music and games. Watch the full video episodes on YouTube, or listen wherever you get your podcasts.
I want to be fair to the giants here — Apple, Alphabet, Amazon and Meta are extraordinary companies, and they all sit in this index too. It is really just a question of proportion: entertainment is a small part of what they do, so the moment you weight by market value, an “entertainment” benchmark quietly turns into a bet on hardware, advertising and e-commerce. What I wanted was the opposite — a lens on the companies for whom this is the whole business: the studios, the labels, the game makers, the streamers, the venues. That is the benchmark I kept wishing for as a CFO (and never quite found), so I built it.